JCtrans membership benefits upgrade - Data Compass is now live
JCtrans News
 15-Sep-2026
“Why are we getting fewer customers lately?”
“We’re receiving inquiries, so why aren’t they converting into business?”
“Our sales team follows up every day. Why aren’t we seeing results?”
These are questions many freight forwarding companies have faced.
There is no shortage of activity. But when business results fall short of expectations, the biggest challenge is often not knowing where the problem actually lies. To improve performance, you first need to see what is holding it back.
Data Compass is now live: built around real business needs, with platform services that keep evolving
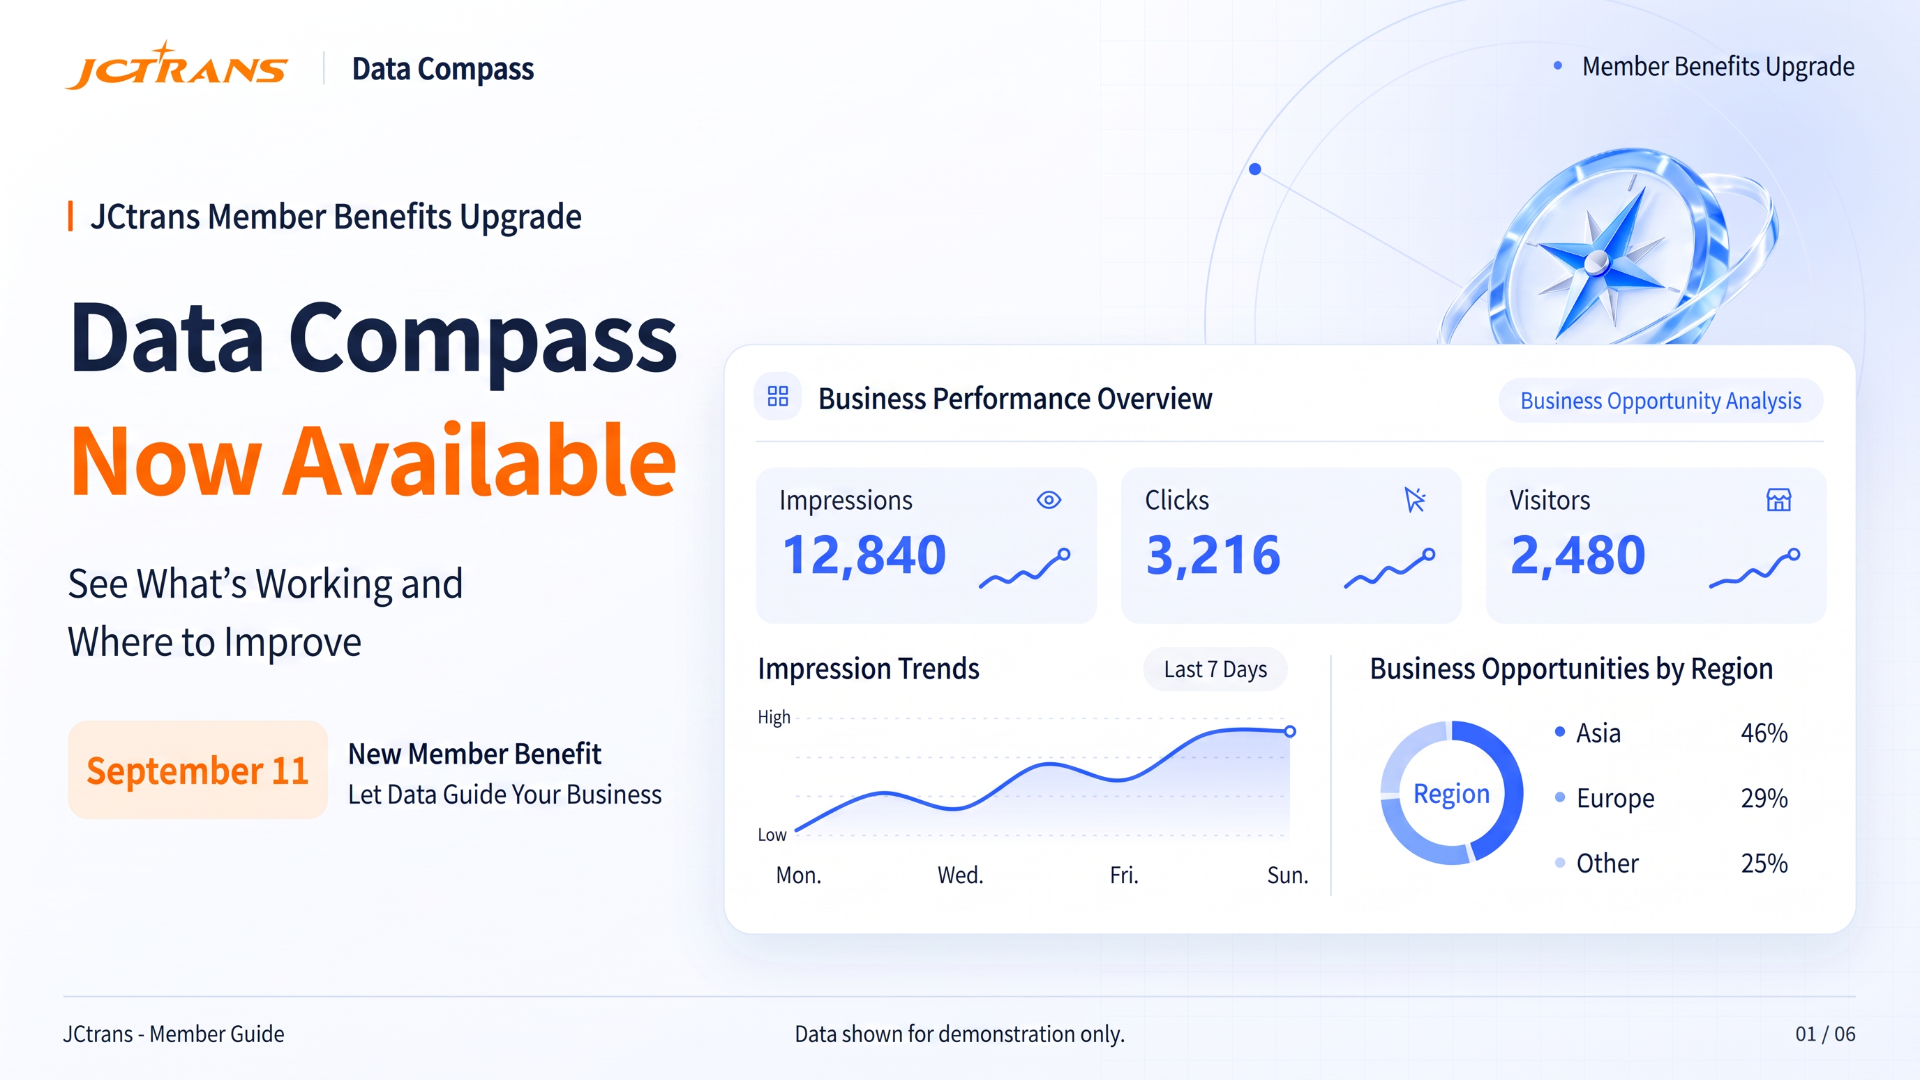
On September 11, JCtrans officially launched Data Compass as part of its upgraded membership benefits.
For freight forwarding companies, access to business opportunities is only one part of what a platform should provide. Once a company joins the platform, other questions quickly become just as important: How can it gain more business opportunities? How effectively are inquiries being followed up? How can transactions be better protected? And how can the company understand its own performance on the platform?
These are all areas where platform services need to continue evolving.
Built around the practical needs of member companies, JCtrans continues to enhance its membership benefits across risk protection, customer success services, business opportunity connections, and operational efficiency, extending platform support across more stages of day-to-day business.
As part of this latest membership upgrade, Data Compass is now officially available. It brings together key business data from across JCtrans in one place, helping companies better understand their performance on the platform and providing data-driven insights for future improvements.
▍Start with the key metrics and understand your business performance
Open Data Compass to view key metrics from the latest reporting period, including:
Impressions, clicks, visitors, interested companies, companies engaged, effective conversations, inquiries sent, and more.
Each metric reflects a different stage of customer reach and business opportunity development.
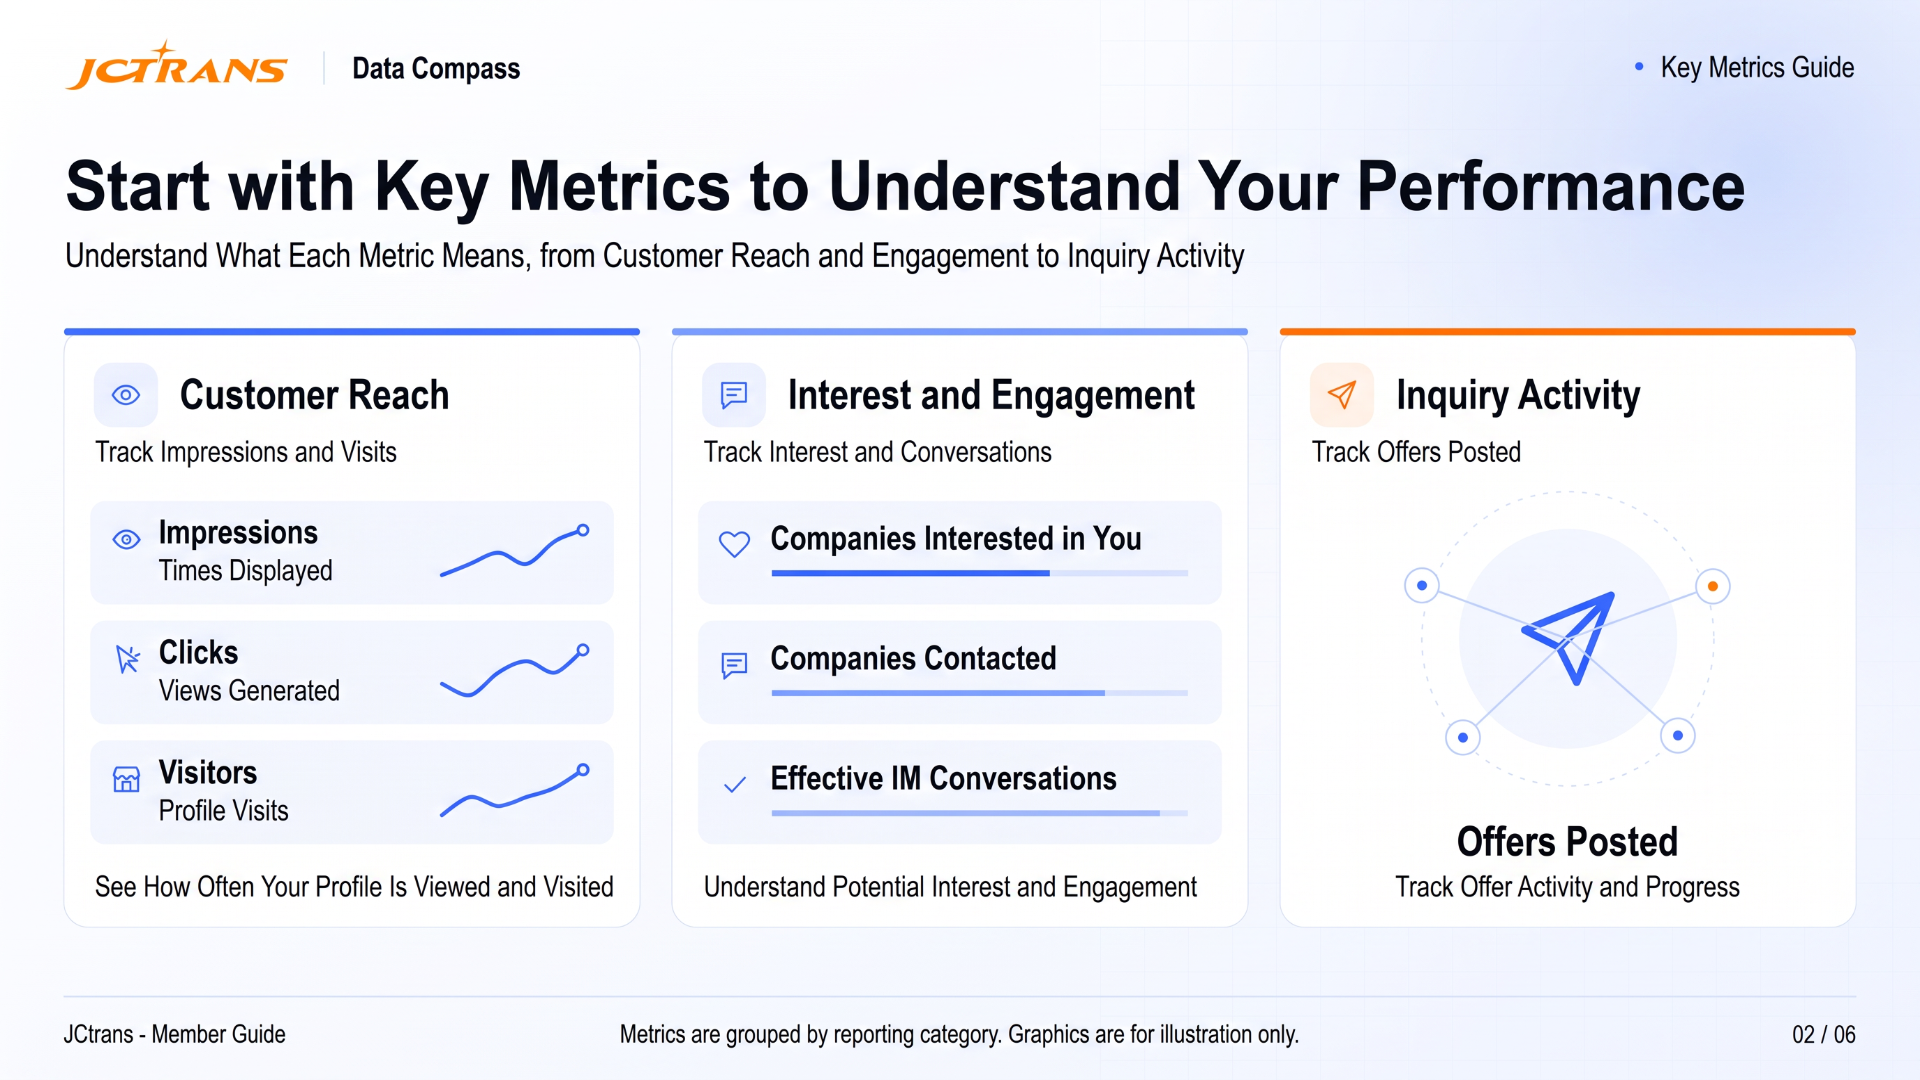
Impressions
See how much visibility your company is receiving across the platform.
Clicks
See how often customers are viewing information related to your company. Together with your company profile, images, videos, case studies, and other content, this can help you assess whether your presence is attracting enough attention.
Visitors
See how many companies visit your company page to learn more.
Companies Interested in You
See how many companies have shown initial interest in your company or services, giving you a clearer view of your potential customer base.
Companies Contacted
See how many companies have already interacted with your business, such as by sending messages or viewing and responding to quotations.
Valid Communications
Understand the level of meaningful business interaction. An effective conversation is recorded when either party initiates a message and both sides complete at least one round of communication.
By looking at these metrics together, companies can gain a clearer picture of how effectively they are reaching potential customers and moving business opportunities forward.
▍Four modules to help identify where business issues lie
Data Compass currently includes four core modules: Opportunity Analysis, Risk Analysis, Transaction Analysis, and Employee Analysis.
Together, they allow companies to review their performance across business development, risk management, transactions, and team activity.
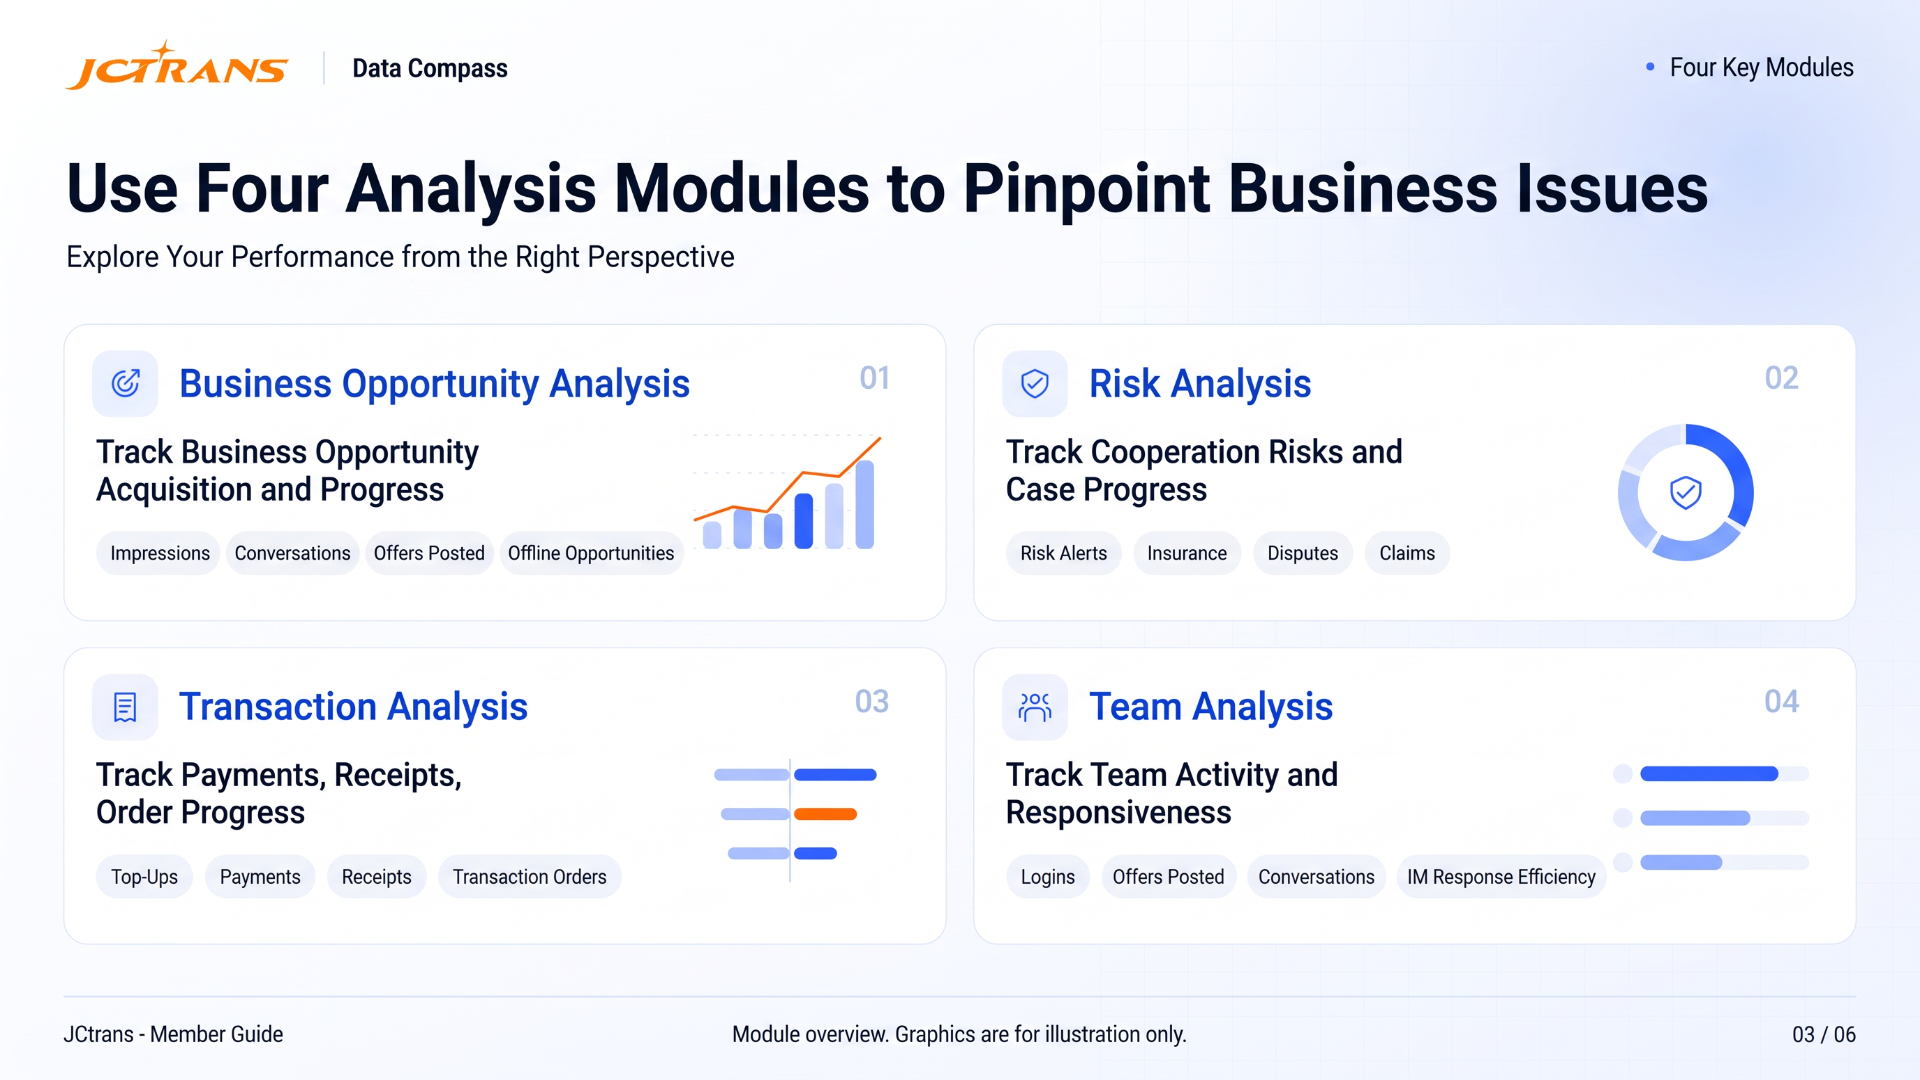
01 | Opportunity analysis
View data on impressions, clicks, visitors, effective conversations, inquiries sent, offline opportunities such as salons and events, and 1-on-1 meetings.
These metrics help companies understand how potential customers move from discovering the business to showing interest, starting conversations, and progressing toward cooperation.
By reviewing this journey, companies can identify where improvements may be needed in both opportunity generation and conversion.
02 | Risk analysis
View information on risk subscriptions, recent changes to partners’ risk status, insurance coverage, disputes, claims, and case progress.
Companies can stay informed about changes in partner risk, while also tracking insurance and case-handling progress to help reduce potential losses during cooperation.
03 | Transaction analysis
View data on JC Pay top-ups, payments, receipts, and transaction orders, as well as transaction progress and completion status for both buyers and sellers.
This gives companies greater visibility into actual transactions conducted through the platform and provides additional insight into their partners’ fulfillment performance.
04 | Employee analysis
View employee activity including account logins, inquiries sent, communication activity, and IM response efficiency.
Managers can better understand how team members are using the platform, identify who is actively engaging with it and who may be underutilizing it, and see where there is room to improve key business activities across the team.
▍Data Compass also shows you what may be worth improving first
Data alone has limited value if you do not know what to do with it. That is why Data Compass also provides actionable improvement suggestions based on relevant performance data.
When highlighted recommendations appear on the page, companies can prioritize the corresponding areas.
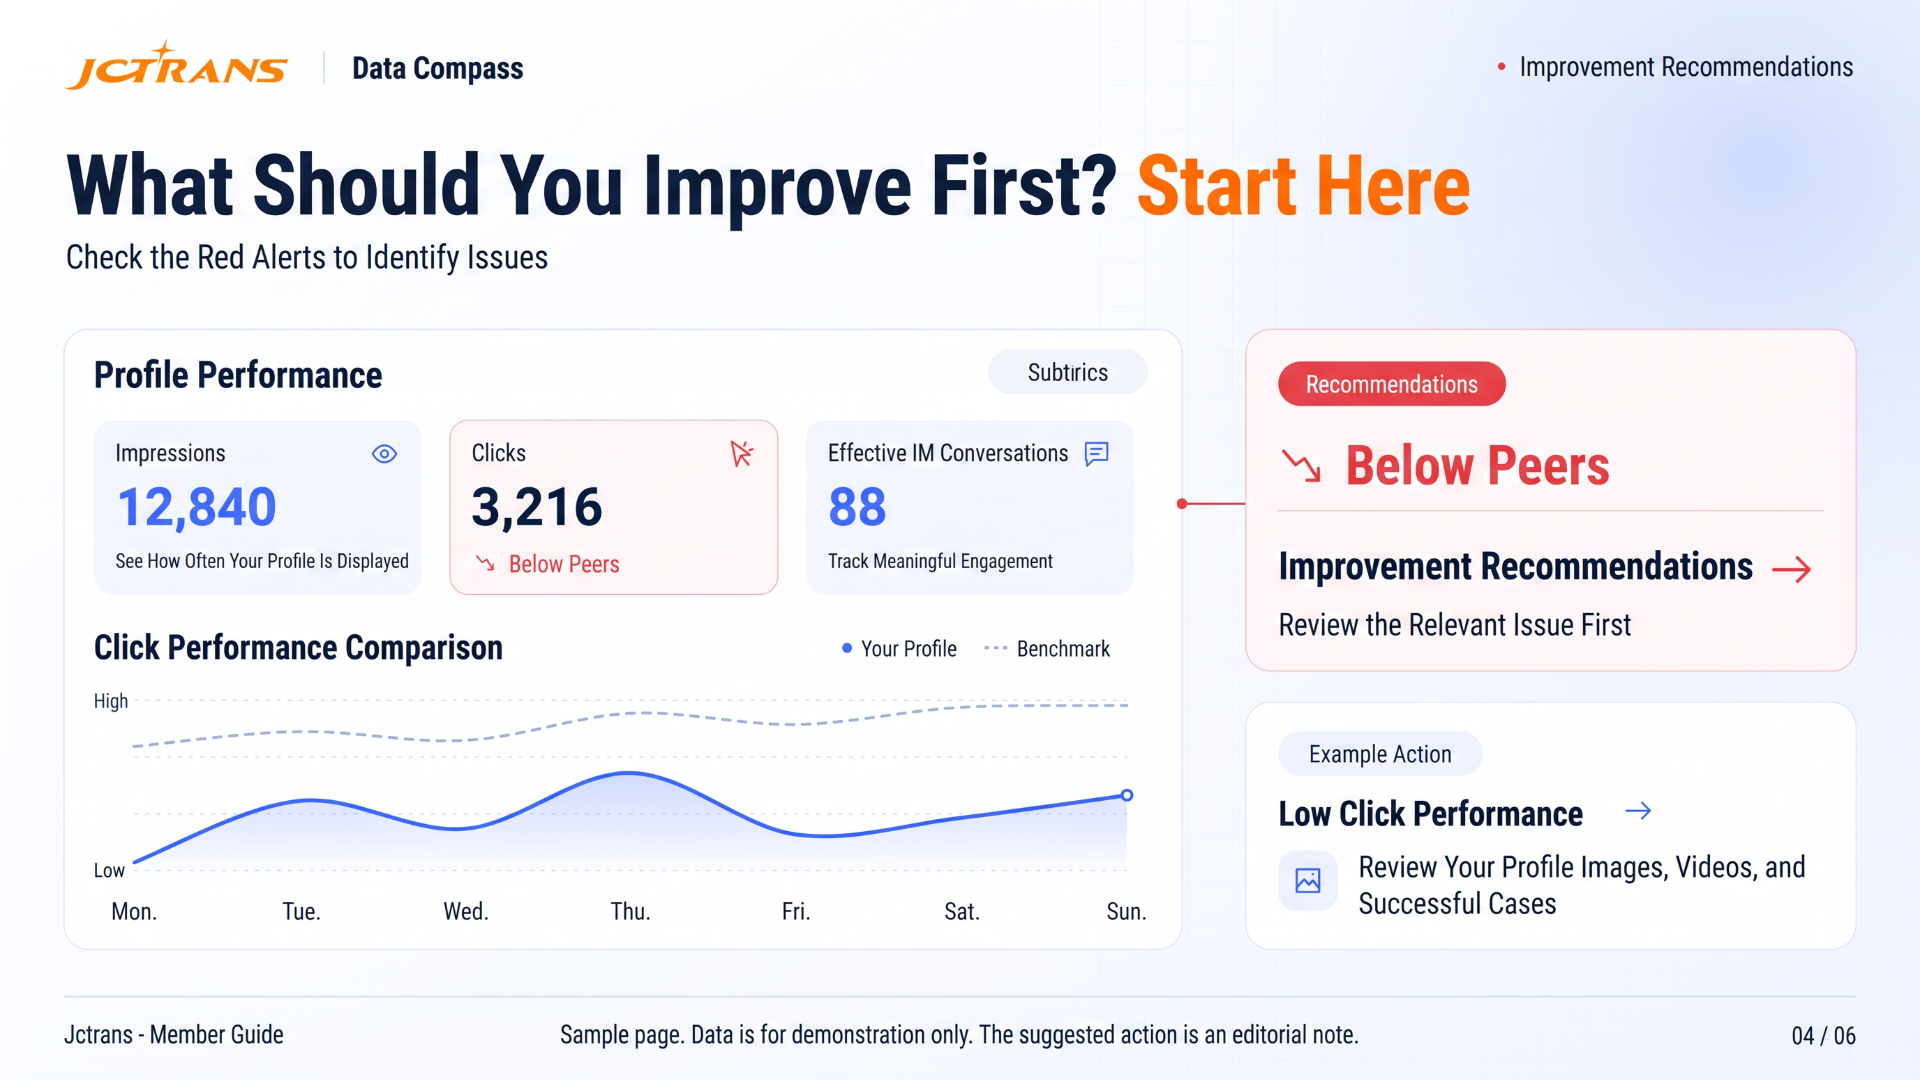
For example:
If impressions are relatively low, consider ways to increase customer reach and visibility.
If clicks or visitor numbers are low, review how your company and services are presented.
If many companies show interest but few conversations follow, potential opportunities may need more timely follow-up.
If a particular business metric is underperforming, open the relevant module to investigate further.
This means companies can go beyond simply asking, “What are the numbers?” and start answering two more useful questions:
Where is the problem, and what can we do next?
When using Data Compass for the first time, there is no need to review every metric at once.
Start with core indicators from the latest reporting period, such as impressions, clicks, visitors, valid communications, and inquiries sent. Then review the broader business opportunity overview, opportunity distribution, company page performance, inquiry activity, offline events, and employee analysis to identify weaker areas.
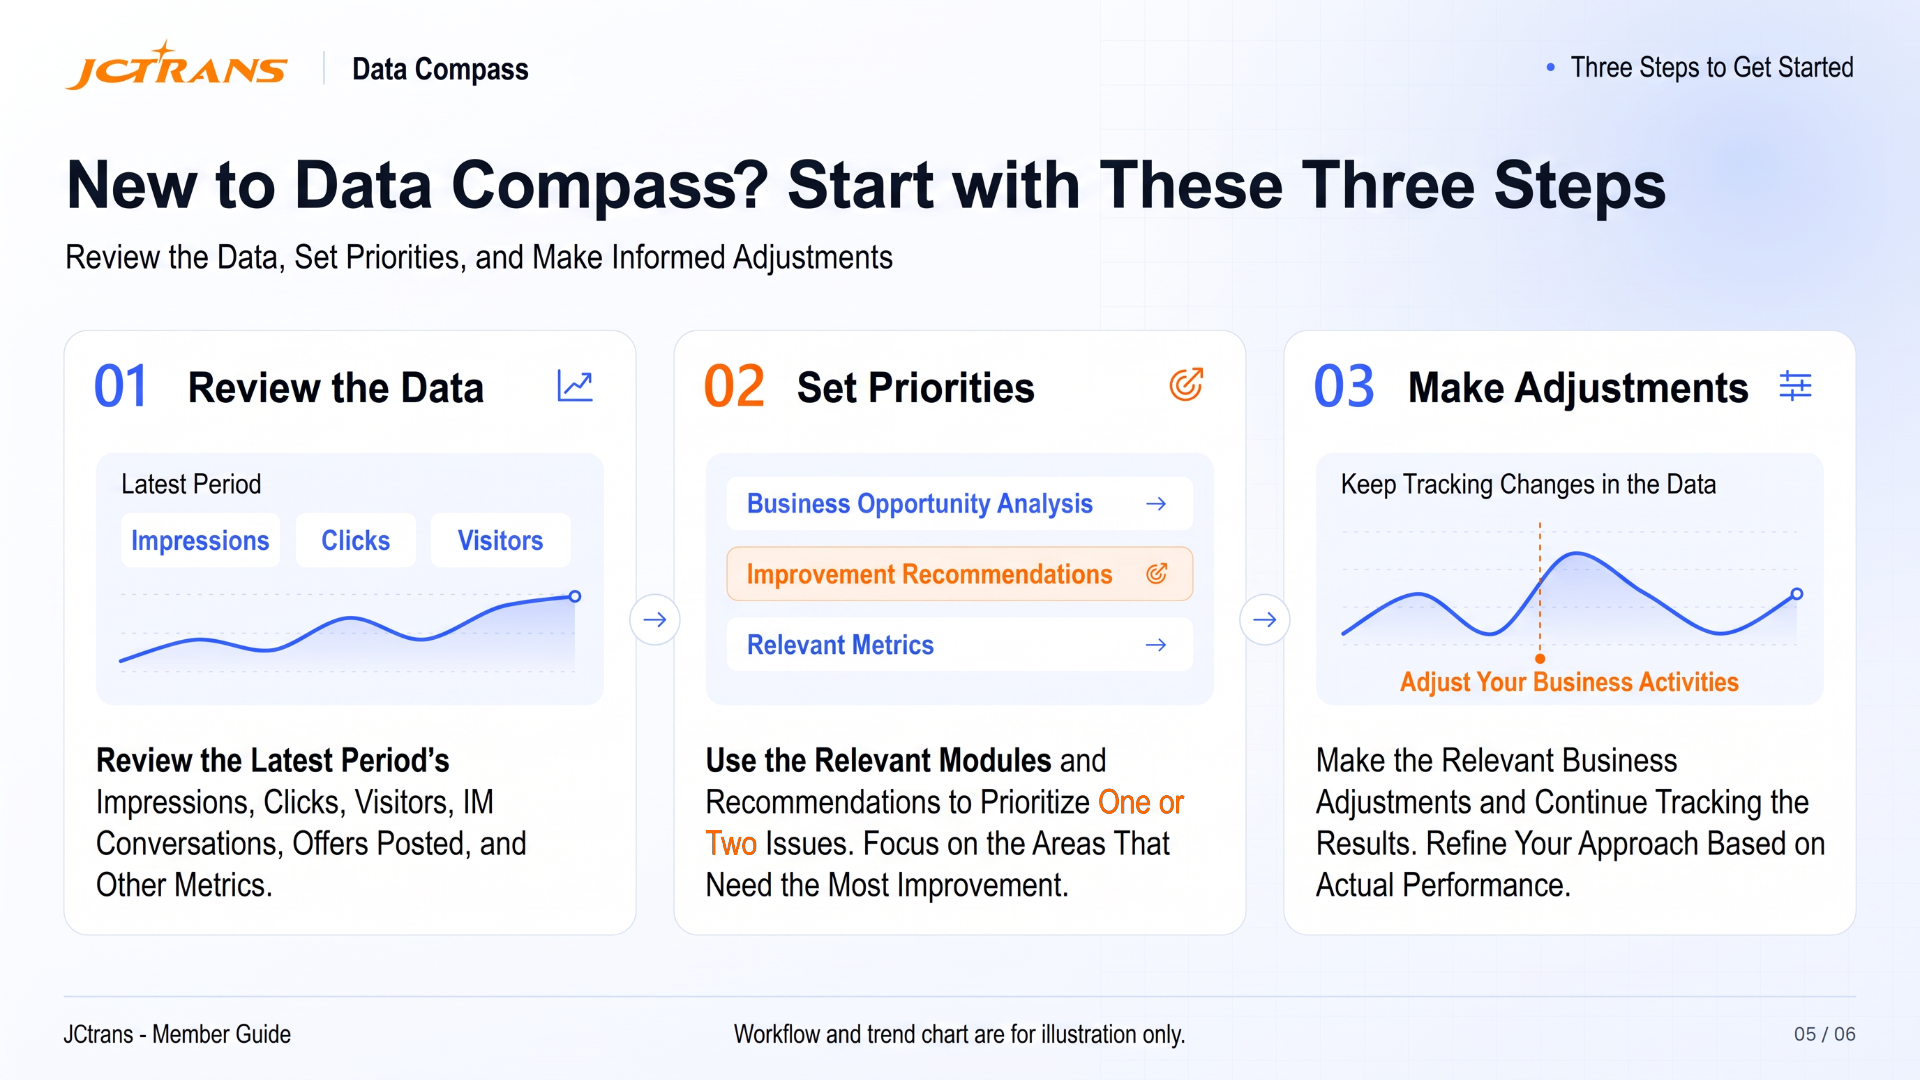
If improvement suggestions are already available, start with one or two priority areas, make adjustments, and continue monitoring how the data changes over time.
September 11: JCtrans Data Compass is now live
Freight forwarding companies generate large amounts of business data every day. The real challenge is turning that data into a clearer understanding of what is affecting business results.
Data Compass does not make business decisions for you. It helps you understand your performance, identify areas for improvement, and make your next move with better information.
If you have ever found yourself wondering:
Why is it getting harder to acquire customers, and where is the problem?
Why are inquiries coming in but not converting?
Why is the team busy every day, yet it is still difficult to tell what needs improvement?
Open Data Compass, take a closer look at your data, identify the gaps, and give every business improvement a clearer basis for action.

Last
Inaugural JCtrans U.S. Regional Conference Explores New Opportunities in North America
The inaugural JCtrans U.S. Regional Conference was held in Las Vegas from September 7 to 9.The event brought together 381 logistic

Next
Nine Days on the Ground in Mexico: JCtrans Member Companies Strengthen Links with Latin America's Logistics Market
Two Key Logistics Hubs | 10+ Organizations and Companies | Multiple Industry-Focused DiscussionsFrom August 25 to September 2, 202
