Ocean Freight from China to the U.S.: Difference Between West Coast & East Coast Ports
Freight Area
![]() 24-Apr-2026
24-Apr-2026
In the Trans-Pacific trade lane, Ocean Freight from China to the U.S. remains the most voluminous and complex segment of the global logistics landscape. For Chinese exporters, selecting the right Port of Discharge (POD)—whether on the U.S. West Coast (USWC) or the U.S. East Coast (USEC)—is a strategic decision that dictates the balance between transit time and cost structure. This choice involves far more than geographical coordinates; it encompasses freight rates, Intermodal Land Bridge efficiency, and last-mile delivery strategies.
Why Does Geographical Location Dictate the Foundation of Logistics Costs?
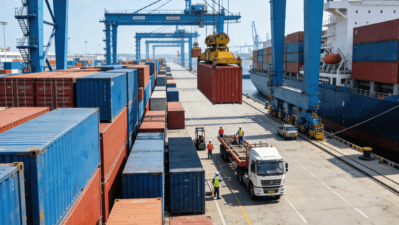
Before diving into the technical differences, it is essential to define the distribution of major U.S. gateways. USWC ports primarily refer to Pacific-facing hubs like Los Angeles (LA), Long Beach (LB), and Seattle. USEC ports refer to Atlantic-facing hubs such as New York/New Jersey (NY/NJ) and Savannah.
Expert Insight:Many novice shippers fall into the "unit price trap." A common misconception is assuming that because USWC ocean freight rates are lower, it is the best entry point for all cargo. In reality, if your final recipient is in Atlanta or Charlotte, the lower ocean freight to the West Coast will be offset by exorbitant inland drayage or IPI (Inland Point Intermodal) rail fees across the continent. Our recommended practice is to use the recipient's Zip Code as the starting point and reverse-engineer the POD based on the "Total Landed Cost."
Transit Time: The Battle Between Express Services and All-Water Routes
Transit time is the most immediate differentiator in Ocean Freight from China to the U.S., primarily driven by physical distance across the Pacific.
How Do USWC Ports Perform in Terms of Speed?
Departing from Shanghai or Yantian (Shenzhen), the transit time to Los Angeles or Long Beach for standard vessels is typically 14–18 days.
● Premium Express Services: Services like Matson (CLX) or ZIM (ZEX) can reduce transit time to 11–12 days due to dedicated berths and expedited discharge.
● Inland Distribution: Once discharged, cargo can reach Midwest hubs like Chicago within 5–7 days via the U.S. Intermodal Rail system.
Why Do USEC Ports Take Longer?
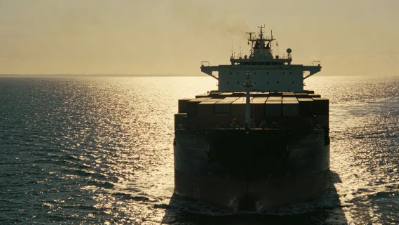
Containers bound for the East Coast must travel via an "All-Water" route, navigating either the Panama Canal or rounding the Cape of Good Hope (depending on current geopolitical stability and canal drafts).
● Transit Data: According to the UNCTAD 2025 Maritime Review, the average transit time for all-water routes to the USEC has stabilized at 32–40 days.
● Forwarder Alert: Despite the longer voyage, USEC ports directly serve the most densely populated consumer regions in the U.S., bypassing the risks and costs associated with transcontinental rail bottlenecks.
Freight Rate Levels: The Economic Logic Behind the FBX Index
Freight rate variance is the core economic indicator distinguishing USWC and USEC routes. According to Shanghai Shipping Exchange (SSE) April 2026 data, there is a clear stratification in pricing between the two coasts.
What Is the Current Price Gradient?
Typically, USEC freight rates are $1,600 to $2,400 higher per FEU (Forty-foot Equivalent Unit) than USWC rates.
● USWC Market Rates: Approx. $3,400 – $4,600/FEU.
● USEC Market Rates: Approx. $5,400 – $7,000/FEU.
● Variable Factors: Based on Freightos Baltic Index (FBX) April 2026 data, this spread is highly sensitive to Panama Canal transit fee adjustments and Bunker Adjustment Factors (BAF).
Why Do USEC Rates Remain Elevated?
We recommend that shippers view this expenditure rationally: the higher USEC rate accounts for increased fuel consumption and canal tolls. However, for heavy goods like furniture or machinery, shipping directly to the USEC often saves over 20% in total costs compared to discharging at USWC and paying for long-haul trucking, as water transport offers superior economies of scale.
Terminal Efficiency and Inspection Risks: Which Is More "Stable"?
Handling capacity and customs inspection frequency directly impact the turnaround time and reliability of your cargo.
Risk Analysis of USWC Congestion
Handling nearly 40% of all U.S. containerized imports, Los Angeles and Long Beach are prone to congestion during peak seasons.
● Inspection Frequency: According to the Port of Los Angeles 2025 Operational Brief, the high volume of e-commerce cargo leads to a statistically higher rate of CBP (Customs and Border Protection) exams at West Coast ports.
● Strategic Move: For time-sensitive orders, prioritize carriers with "expedited delivery" services and dedicated terminal space to minimize dwell time.
Operational Advantages of USEC Ports
USEC ports like Savannah have aggressively invested in automated infrastructure to improve throughput.
● Automation Levels: Per Georgia Ports Authority (GPA) 2025 data, the single-terminal model in Savannah significantly reduces container re-handling in the yard, ensuring stable and predictable pickup speeds.
● Common Misconception: Many believe smaller ports mean slower service. In reality, USEC ports often demonstrate better resilience when handling sudden surges in cargo volume compared to the heavily burdened LA/LB complex.
Strategic Distribution for E-commerce Shippers
For sellers utilizing FBA (Fulfillment by Amazon) or third-party overseas warehouses, port selection directly affects FedEx/UPS Zone Rates.
How to Optimize Your Warehouse Layout?
● West Coast Presence: Ideal for national distribution with a focus on Western and Central states; however, shipping to the East Coast from here incurs high courier surcharges.
● East Coast Presence: Critical for heavy goods or high-value items intended for the New York, Boston, or D.C. corridors to keep last-mile costs low.
● Forwarder View: Forwarders must note that as last-mile costs continue to rise, a "Multi-Point Entry" strategy is now the gold standard. Allocating 65% of volume to the USWC and 35% to the USEC (via Savannah or NY) can effectively hedge against inland logistics premiums.
Conclusion
In conclusion, the choice between the U.S. West Coast and East Coast is not a simple matter of "which is better," but a strategic trade-off between lead time and landed cost. The USWC offers speed and lower ocean rates but faces higher inland costs and potential congestion. The USEC requires longer transit and higher ocean rates but provides direct access to prime consumer markets, bypassing expensive transcontinental hauls.
In the volatile 2026 market, decision-makers for Ocean Freight from China to the U.S. should closely monitor the FBX Index and real-time port dwell times. By selecting the port that best aligns with your product’s margin and turnaround requirements, you can ensure a seamless and cost-effective flow for your Ocean Freight from China to the U.S. logistics chain.
Last
Which Incoterm is Best for Ocean Freight from China to the U.S.?
In the complex chain of Trans-Pacific trade, Ocean Freight from China to the U.S. is more than just the physical movement of cargo
Next
What Documents Are Required for Customs Clearance in Ocean Freight from China to the U.S.?
In the era of digital trade, although logistics tracking technology is advancing rapidly, "documentary compliance" remains the mos