What are the Primary Destination Ports for Ocean Freight from China to the U.S.?
Freight Area
![]() 24-Apr-2026
24-Apr-2026
In Trans-Pacific trade, the choice of Destination Port (POD) determines not only sea transit time but also total final-mile cost. The U.S.’s vast geography creates large differences in infrastructure, yard management, and inland intermodal (IPI) efficiency. For exporters and e-commerce sellers, mastering West Coast, East Coast, and Gulf Coast ports is essential for a resilient supply chain.
Why Destination Port Selection Is Critical
The POD is not just an unloading point — it defines your inland intermodal strategy. Proximity-based entry is the golden rule for cost control.
Expert Insight:Many new shippers focus only on ocean freight rates, assuming costs change uniformly nationwide. In reality, drayage from Los Angeles to New York can cost more than shipping directly to the East Coast.Best Practice: Segment by consignee ZIP code and choose the POD that minimizes Total Landed Cost (ocean freight + terminal fees + last-mile delivery).
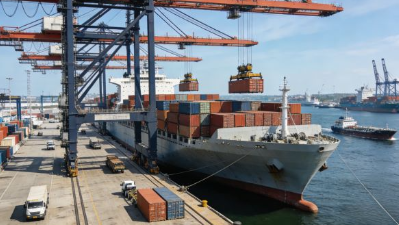
U.S. West Coast (USWC) Ports: Trans-Pacific Gateways
The closest entry point from China, with the highest cargo volume and sailing frequency.
1. Port of Los Angeles (POLA)
North America’s busiest container port, handling ~40% of U.S. container imports (Q1 2026).
● Advantage: Top express services (Matson CLX, ZIM ZEX), transit 11–15 days
● Alert: High congestion and chassis shortages in peak seasons
2. Port of Long Beach (POLB)
LA’s “twin port,” famous for automated terminals (LBCT).
● Strength: Fast vessel turnaround (Drewry 2025 Port Efficiency Report)
● Recommendation: Best for IPI rail to Chicago, Detroit — on-dock rail is highly efficient
3. Northwest Seaport Alliance (NWSA: Seattle & Tacoma)
Gateway to the U.S. Pacific Northwest.
● Best For: Washington/Oregon destinations; avoids California congestion and lower THC
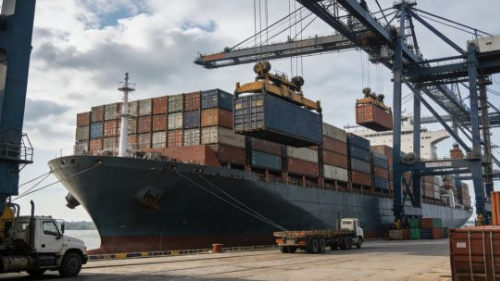
U.S. East Coast (USEC) & Gulf Coast (USGC) Ports
Direct all-water routes help avoid West Coast rail bottlenecks.
1. Port of New York & New Jersey
Largest Atlantic hub, growing Trans-Pacific connectivity (UNCTAD 2025).
● Role: Serves the U.S. Northeast (NY, PA)
● Myth: Longer transit (30–38 days), but heavy cargo saves cost by avoiding cross-country rail fees
2. Port of Savanna
Fastest-growing U.S. retail distribution hub
● Tip: Large bonded warehouse clusters; ideal for Southeast U.S. cargo (Atlanta, NC)
3. Port of Houston
Leading Gulf Coast port, top for energy and bulk commodities (2025 Annual Report).
● View: Direct all-water to Houston offers stable rates and avoids rail transfer risks for Texas cargo
Decision Metrics: Rate vs. Transit Time
All-Water vs. Mini-Land Bridge (MLB)
FBX April 2026: USWC ↔ USEC spread ≈ $1,600–$2,200 per FEU.
● For Speed: West Coast discharge + intermodal rail (MLB)
● For Cost: Non-urgent cargo → All-water to USEC/USGC
Terminal Operations & Pickup Efficiency
Terminals differ in pre-pull and drayage rules. Peak-season “closed yards” increase truck queuing time — always use real-time terminal dwell data.
Strategic Port Recommendations by Business Model
● E-commerce Sellers: Multi-point entry. 60% inventory on USWC (LA/LB) for speed; 40% via Savannah/NY to lower zone delivery costs
● Heavy Goods Exporters: Choose ports with strong gantry cranes and long free time (Baltimore, Houston)
● Risk Mitigation: Include a “flexible port” clause in contracts to switch POD during strikes or congestion
Conclusion
Choosing a POD requires balancing rates, terminal efficiency, drayage costs, and inventory placement. Each port offers unique value: LA for speed, NY for reach, Savannah for growth, Houston for stability.To optimize China–U.S. ocean freight, evaluate ports based on total logistics cost, not just ocean rate.
Last
How Much Does It Cost to Ship a Container from China to the U.S.?
In the realm of international trade, shipping cost is a dynamic and multifaceted function. Particularly on the Ocean Freight from
Next
What are the Primary Ports of Loading for Ocean Freight from China to the U.S.?
In global commerce, the Trans-Pacific trade lane remains the busiest and most vital route for container shipping. Ocean freight fr